Glean N-View Network Performance Monitor
Pin down "the network is slow" with numbers.
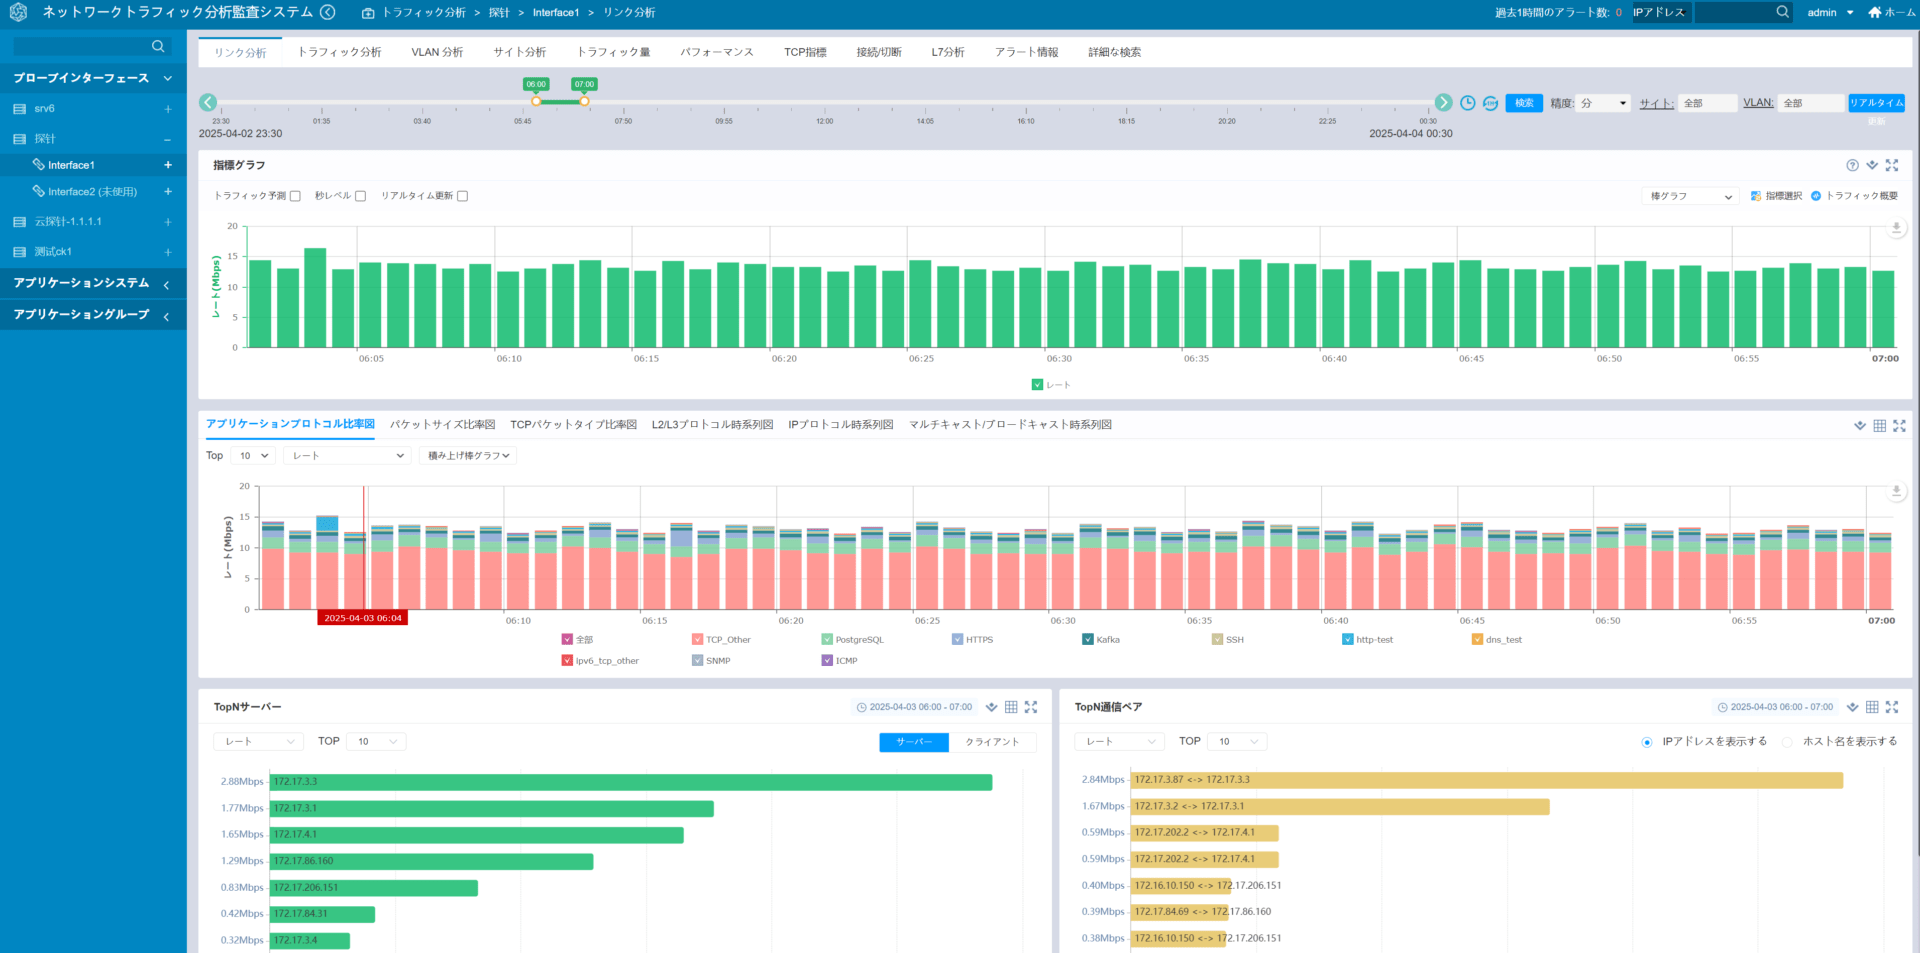
“The app is heavy.” “The cloud is slow.” Vague complaints from users. But is the network really the cause, and where exactly is the bottleneck? Can you answer that right away? Glean N-View visualizes network and application performance in real time, catching the early signs of a problem so you can act before it becomes an outage.
Why Glean N-View
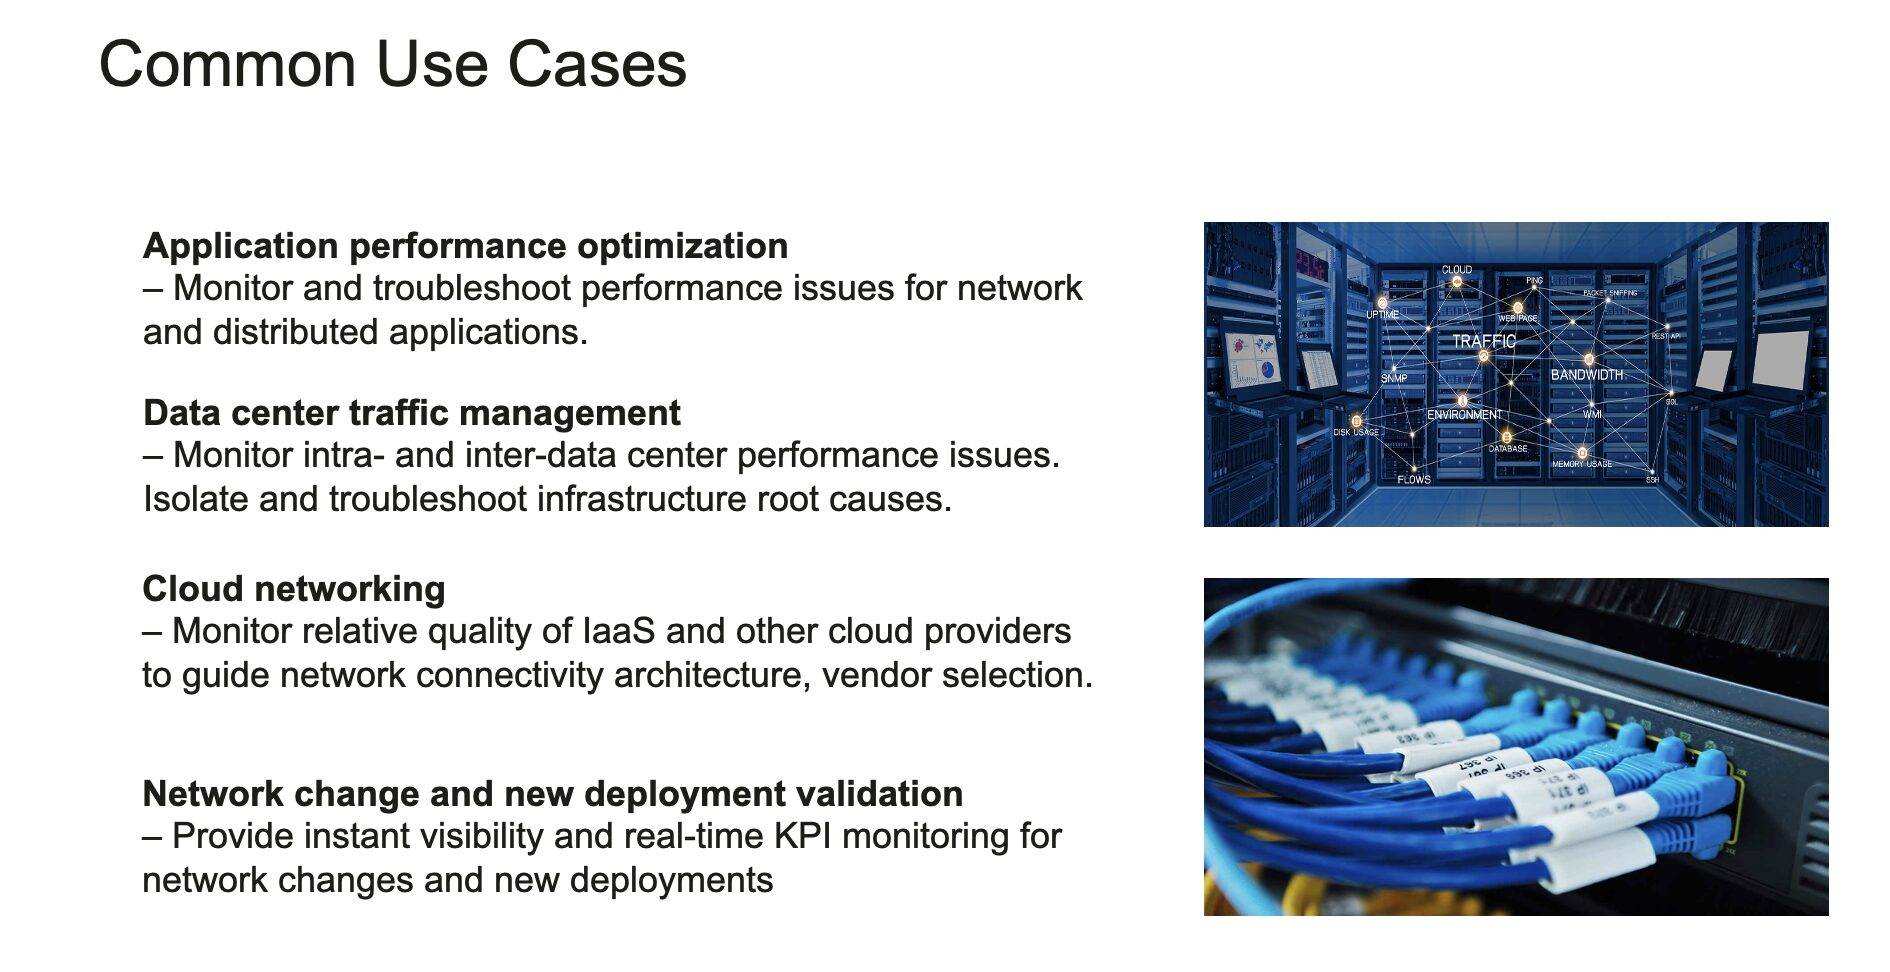
- Quantify business impact: show which business processes a given delay affects, turning “it just feels slow” into numbers that support clear decisions.
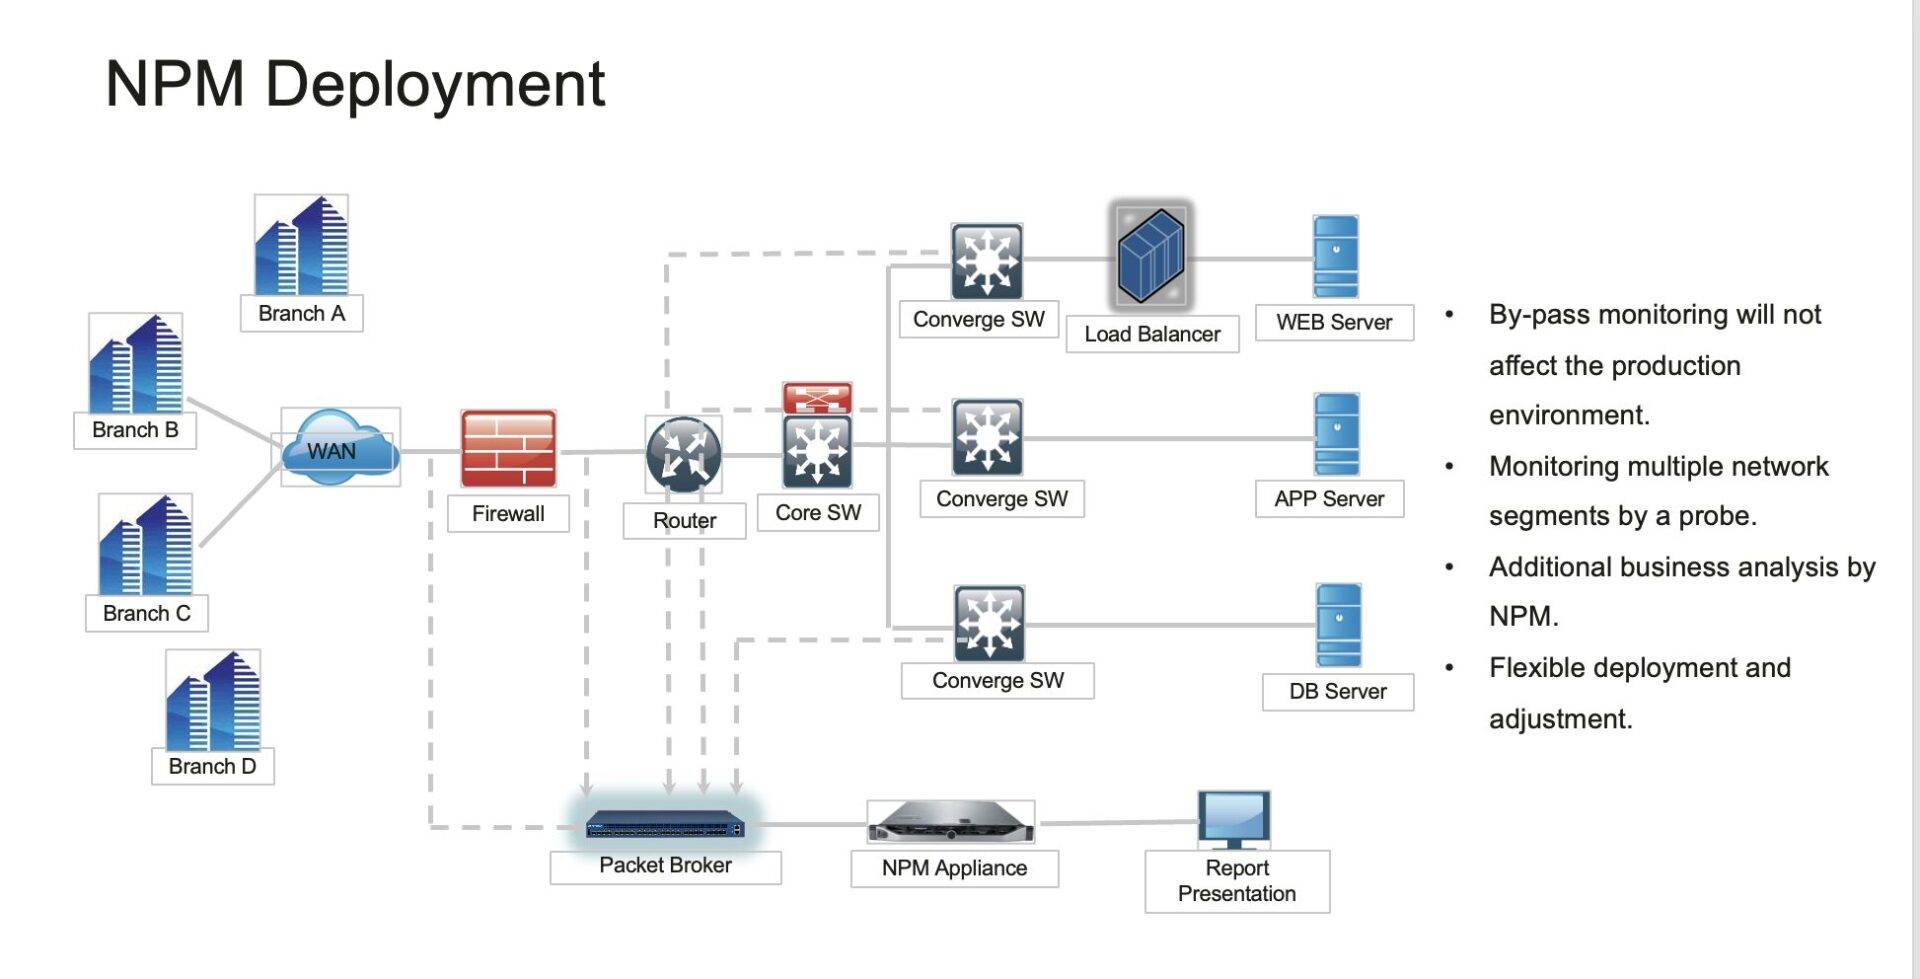
- Clear the cloud/hybrid blind spots: locate hard-to-see bottlenecks from on-premises to cloud, and optimize across the whole environment.
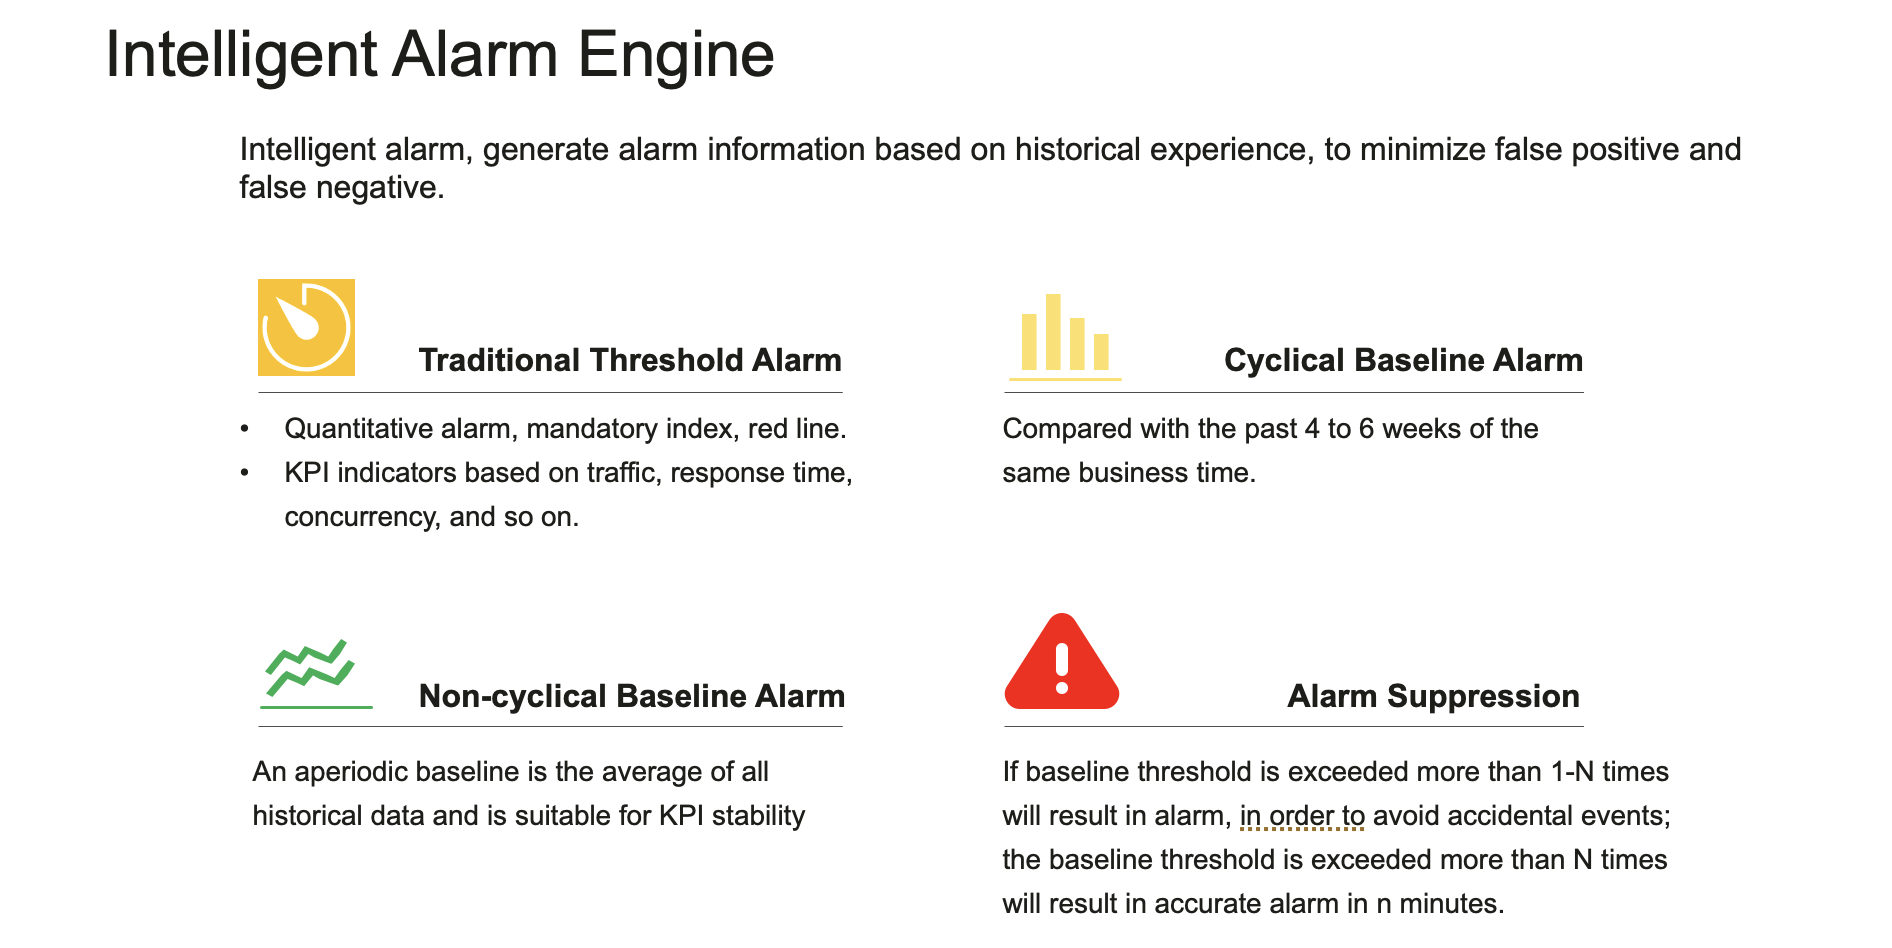
- Detect problems early: catch the signs of degradation before outages or complaints occur.
- Remove “blame the network”: identify the cause with hard data, ending the finger-pointing and smoothing collaboration between teams.
Deep analysis: Raw Packet Decode
Analyze past traffic at the packet level, with advanced filtering and up to 60% data compression for long-term retention. Integration with SAN external storage allows large volumes of data to be retained and traced.
What is NPM?
Network performance management is a set of operational policies and workflow strategies for preventing, mitigating, and resolving network performance issues. Glean N-View is designed as an all-in-one solution that puts NPM best practices into practice straight away.
Glean N-View Network Performance Monitor
- Key KPIs
- Network latency, TCP connect time, UX time, TCP retransmit rate
- Deep analysis
- Raw Packet Decode
- Storage
- Up to 60% compression; SAN external storage